How High Can You Go?
Y’all know I like rotary-shouldered connections, right? It amuses me to no end to talk about their delightfully-unexpected capacities, how they work (or don’t), and what those crazy names mean. (Hit me up if you know why the “low-torque modification” is called that when a “low-torque” connection has a higher makeup torque than a regular “full-face” connection. I’d *really* like to know.)
So when I stumble across some unexplored territory associated with my beloved RSCs, I get positively giddy. Like such as: how much pressure can my drill pipe connection carry?
Well?
You don’t even know where to go, because there is no standard way to figure it out, no documented calculation that everybody agrees to. The whole blasted drilling industry doesn’t know how much pressure our connections can live with!
(This is actually a good example of how engineering has changed over time. In the 30s and 40s, when most of our RSC designs came out, good engineers worked through the designs as best they could, making whatever assumptions were needed to get to a viable answer. Then they put a few of them in service to see if it worked. If it did, great! If it turned into a flaming fireball … well, mebbe let’s try that again. Now most companies won’t even consider new products until they’ve been computer-modeled and stand-tested to within three quarters of an inch of their life, but they keep using the older technologies because they have “field experience,” which is code for “somebody else volunteered to be the guinea pig.” For better and worse, we’re disinclined to be rodents these days, even though it’s How the West Oil Patch Was Won.)
Surprising though our lack of pressure-capacity-knowing may be (and, indeed, is), it honestly doesn’t come up all that much, which is why we’ve gotten away with not defining it. Our connections carry enough pressure to pump the mud, and while that’s significant in absolute terms, for our beefy pipe it tends to be relatively small. (Related: we rarely have pipe-blow-up failures in drilling—tension and torque are much more significant. OCTG is a chromatically-varied equine, of course.)
But! Kids these days are drilling bigger, badder wells than ever, with correspondingly bigger, badder standpipe pressures (and everything else). We’ve made it to the point that, occasionally, people ask me how much pressure my poor drilling connection can stand.
Answer: Beats me.
Wait! Come back! I’ll take a stab at it. (I mean, I can’t charge for “beats me,” so I gotta come up with something that sounds better.)
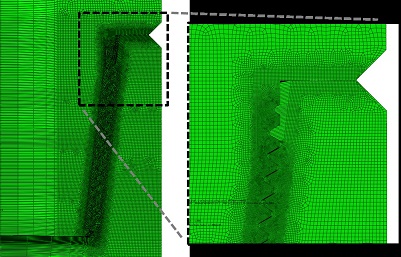
Let’s start with a little analysis of elements that are finite (I love me a good FEA model). The model itself is fairly simple: draw and mesh the connection, apply makeup torque, then apply pressure, and see what happens.
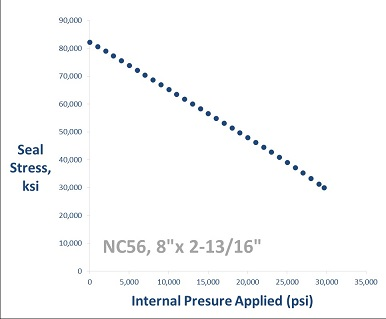
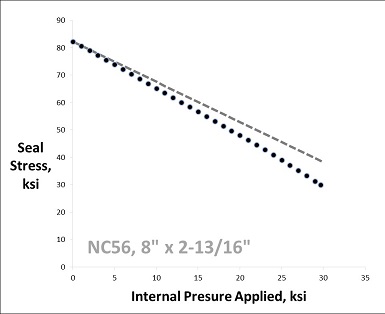
There’s a lot going on in a model like this: we use non-linear, elastic-plastic material properties; the geometry is clearly tricky (i.e. mathematically non-linear); and those threads are allowed to slide past each other in a non-linear way. With all the “non-linear” going on, the results are a bit of a surprise:
Looks a lot like a line, no?
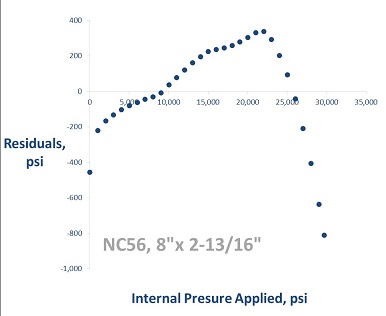
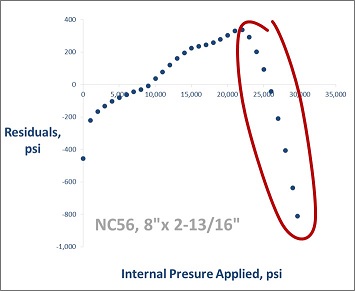
Honestly, it’s not a line. I can study the residuals … you know what that is, right? You construct the least-squares regression line through the data you have, then for each individual point you calculate the difference between the data and the best-fit line. It’s a handy trick because it allows you to see more clearly if there’s a pattern to your data or if it’s just random variation. (It also impresses your pre-calculus teacher—thanks Mrs Doyle!)
In our case, a residual plot makes it clear that our data isn’t really linear:
Still, it’s pretty close to linear, so I’m going to pretend it’s linear. That way I’ll be able to make an “analytical model” (a.k.a. a formula so I don’t have to run a full-frontal FEA model every time I change some tiny detail about my connection).
Arright, so … analytical model. My seal stress plot (the first one, not the residuals) says that, overall, I start with a seal stress from making up the connection. I can calculate that pretty easily with good ol’ A.P. Farr.
Once the internal pressure starts up, though, the seal stress goes down (in our almost-linear way). Why might that be?
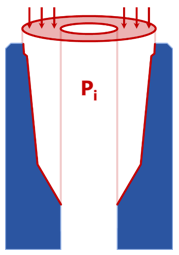
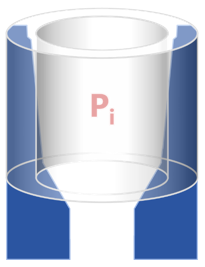
The most obvious answer is what I’ve heard called a “pump-open” force, where the change in ID geometry creates axial area for the pressure to push on. Thus, more internal pressure => less seal stress.
Ok, so I bang on the math a bit and work out what the seal stress should do if it was decreased by the internal pressure multiplicitated by the pump-open axial area: see the dotted line below.
And see how it’s wrong. Or at least, not enough—I need more seal-stress-smallering from my internal pressure. There must be another effect that I’m missing.
That other effect would be the Poisson effect. (Yes, I looked up Siméon Denis Poisson on Wikipedia, and yes, I learned an absurd amount of French and mathematical history. Do you know how much crap is named after him? There’s a crater on the moon and a method of digital image processing named after him—and he died in 1840.) If you apply internal pressure on a cylinder, it will get fatter (cuz that’s the direction it’s being pushed), but it will also get shorter. That shortering of a box would also effectively lower the seal stress.
Now, it’s easy enough to find the shortering (yes, I am purposefully spelling that wrong, it’s fun to say in my head) of an actual cylinder. My box is not a cylinder, but because I’m trying to build an analytical model I’m going to try to find a cylinder size that will work as a proxy. (Tracking the response of the real geometry is work for FEA software, doncha know.)
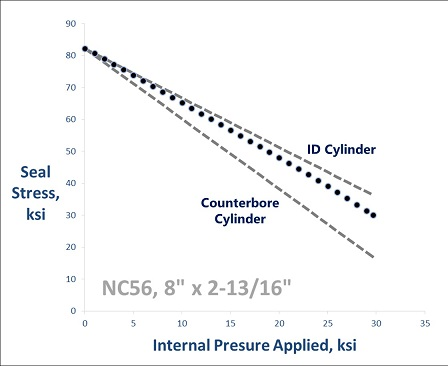
The extremes would be the thickest possible cylinder (i.e. the OD and ID away from the connections) and the thinnest possible cylinder (that’d be the counterbore area). Them don’t work, neither:
The cylinder constructed from the ID (i.e. the whole durn thing) is too stiff—it doesn’t change its seal stress fast enough to keep up with the actual FEA results. The cylinder only using the counterbore is too flexible, decreasing the seal stress much too fast. So we need some sort of average value.
I’ll spare you The Search for Goldilocks; lots of different connection parameters were pretty close (the average between the counterbore and the ID, the average thread size, the ID at halfway up the threaded region, etc, etc). I chose a dimension called Rt as the one to use, mainly because it was one of the pretty-good options and it’s already built into the connection calculations we’re so familiar with (it’s the average radius of the threaded region, in case you care).
How’d I do?
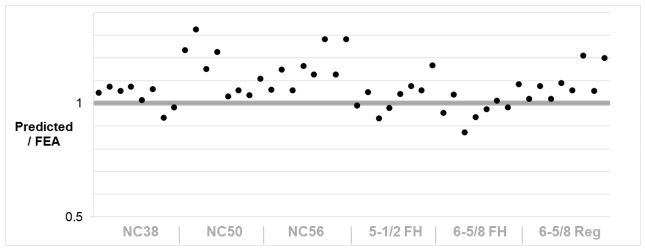
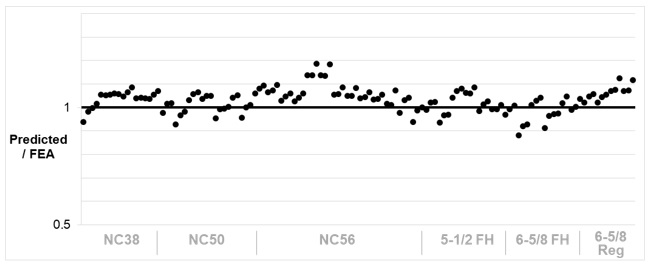
I know, I know, that graph means nothing to you. It’s a comparison of slopes. For each connection (like our NC56 with an 8" box OD and a 2-13/16" pin ID that we’ve been using as our example) you can describe two different slopes: 1) the one predicted by our math (taking the pump-open force and the Poisson effect into account), and 2) the one found by fitting a line to the FEA analysis data. I can smash them all onto the same graph by dividing the one by the other (Predicted / FEA, as you see on ze left).
If that ratio was exactly 1.0, then my prediction would match the FEA data perfectly. If the ratio is bigger than 1.0, my prediction thinks that the internal pressure will have a greater effect than FEA says that it has—that’s the conservative result. If the ratio is less than 1.0, then FEA says pressure will do more to my connection than my equation says—the non-conservative result.
Ok, so cast your eyes back up there at my ratio graph. Not bad, yeah? All the data points are reasonably close to 1.0, and when they miss it’s more often on the conservative side. But really, I wanted it to be better; some of those bad boys are off by 30%, which is no bueno.
I can actually do better just by using my noggin a little more on the data itself. Remember the residuals?
The worst points—that is, the most non-linear—happen at the end, when the applied internal pressure is the highest. In fact, most of those points have an internal pressure that is higher than the average seal stress, which almost certainly means that it’s already leaking and this model doesn’t really mean anything anymore.
Now, that’s bad news if you were really hoping to contain those high pressures, but it’s good news for our linearity. I can remove all the data points that have an internal pressure bigger than the seal stress (on the presumption that the connection’s leaking like a sieve) and then recalculate the “FEA” slopes to be a closer fit in the region that’s important. That improves matters a great deal:
(No, it’s not perfect, what do you want from me?! It’s an easy-to-apply calculation based on linearization of a super non-linear situation, and we land within 10% most of the time and tend toward conservatism. Use a safety factor, for Pete’s sake.)
So! Now I can answer the question from before: how much pressure can my drilling connection handle?
Answer: Beats me. (Still.)
Erm, Grant, wasn’t all that math and modeling and such supposed to give us that answer?
Yes, yes it was. And it does a good job telling me … the average seal stress under a given loading. Not, strictly speaking, the pressure capacity.
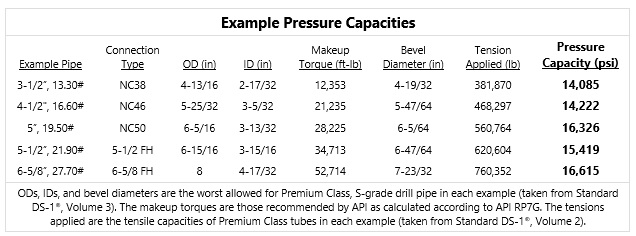
Now, look, if we assume that failure happens if seal stress ≤ internal pressure, now I can calculate it for you:
But you notice that those numbers are probably higher than you thought—I mean, offshore we pay extra money for specially-designed completions connections because they’re rated all the way up to 10,000 psi. Is seal stress ≤ internal pressure a valid failure criteria? Maybe it needs derating (90%, 80% of that)? Maybe it’s actually the seal stress profile that matters more than the average? How do we deal with pits or cuts or surface roughness?
It’s a lot of questions, man. “More research is needed,” as we like to say when we write papers.
(Have I mentioned that this comes from a paper I wrote? It does.)
Still (to stop talking in my Eeyore voice), we have a way to find the seal stress analytically (read “cheaply”) when we start applying pressure to the connection, and that’ll help us start making intelligent decisions. And maybe saving money if those 10+ ksi pressure capacities are legit …
