Bad Day, Good Day
You Know what's a bad day?
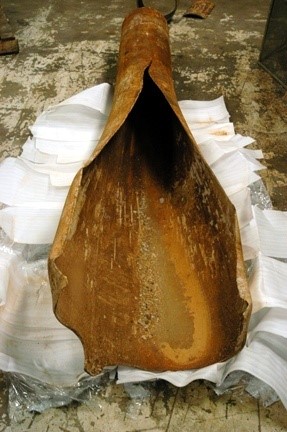
I think that qualifies. (I’m not sure how they got it out of the hole …)
I can’t help too much if that kind of day has already happened to you; I’m available for hugs as needed. But I might be able to head it off at the pass.
First, that was a casing wear failure—the intermediate casing was perfectly good when it was installed, then the drill string did unspeakable acts to it while the next hole section was drilled, and the wall wore down real thin like. Leading to your Daniel Powter situation.
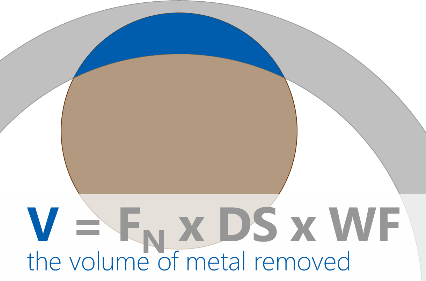
How, then, does one avoid said bad day? By predicting it of course; if you know it’s coming, you can do something different to stop it from getting here. Here’s the formula:
Before I even define my terms, it’s good to know something: this formula is not one of those “start with Newton’s 2nd Law and the gravitational constant and derive this” kind of things. This is a rough guess at maybe how it might work, sorta. (Actually, it doesn’t work this way. We’ll chat about it later.) What this formula does tell us is the drivers for what wears out your casing: the three terms on the right represent three areas that we can focus on to try to minimize our likelihood of sad.
Alrighty then, let’s start with … V!
That’s, you know, the amount of casing wear. You have to do some arithmetic to turn “volume worn” into “wall thickness remaining,” but I’ll leave that as an exercise for the reader. The formula is thus pretty clear: we want V to be small, so we want all the terms on the right side of the equal sign to also be small so’s we can minimize our casing wear.
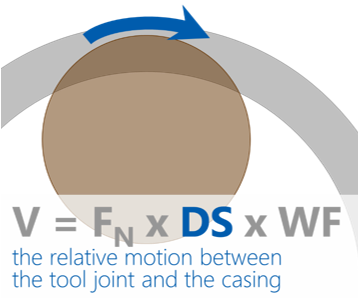
Next up … FN:
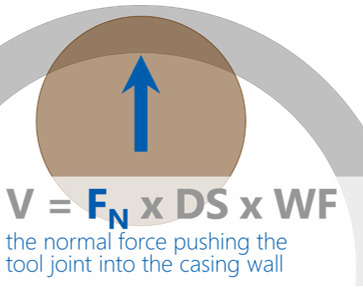
Makes sense, right? The harder you push the tool joints into the wall, the faster the casing will wear away. Converse-like, if you want to keep that casing metal there, don’t push so hard.
Obvious though that sounds, making it happen falls into two categories, methinks. First is your trajectory.
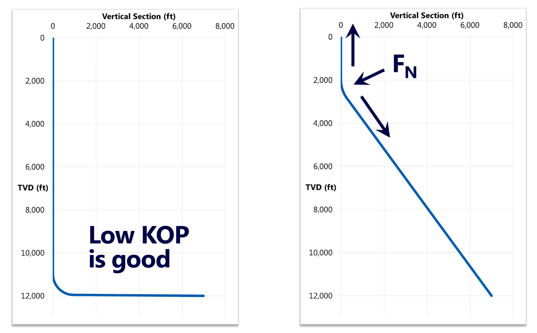
Both of those imaginary well designs get to the same target in the end, but the one on the left (with the lower kick off point) does it with aplomb. If we kicked off higher, like on the right, then all that drillstring weight would be pulling the string around the unavoidable curve way up high. That will always create a lot of side loading that you can’t get away from, making your casing wear awful. (And your tool joint wear. And your torque. And your hookloads. And probably your fatigue damage. It’s just not a good idea, ok?)
Ok, so lower your kick off point as much as you can, like the one on the left. I know, I know, you’ve got collision problems to deal with, you’ve got some formation that you can’t build in, you’ve got completions people complaining about something or other (like always). It’s easy for me—I just drew that crap on paper. Still, pushing your KOP as low as you can will almost always lead to better results, so see what you can manage.
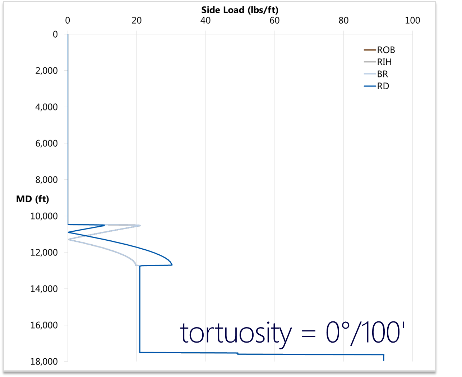
Second, let’s run that imaginary well through my torque & drag modeling program.
This is the result for exactly what I drew in that “Low KOP is good” picture. Straight down to 11,000' or so, build to horizontal, drill a lateral out about 7,000'. That’s what I tell my computer, that’s what my computer does … because my computer is stoopid. There’s no such thing as a perfectly straight, vertical hole. I can see that we’ve made a dumb assumption when I look at the results—the side forces through the vertical section are precisely nada, because my perfectly-vertical drillstring is hanging in my perfectly-vertical well without touching the wall. That’s not how things work.
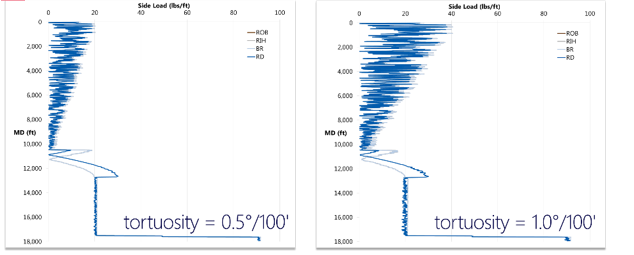
To correct our dumbidity, we add “tortuosity,” a measure of the wiggle of our well around the planned well path. You see two options down there: 0.5°/100' and 1.0°/100'. When I’m doing a torque & drag model, if I get no information at all about the typical tortuosities for that area with that drilling method … I usually whine and complain until I do. Defaults suck. Still, if you make me pick a default, generally-average number for tortuosity, I’d (sulkily) choose 0.75°/100'. Thus, my two examples are a little bit lower than average and a little bit higher than average, but both still well within the range of what’s common.
Wiggly holes give you more normal force, which is probably what you’d expect … but notice where the normal force increases. The horizontal section (about 13,000' to 17,500') keeps basically the same side load at both tortuosity levels. It’s the shallow sections—where the tension is high—that are more affected by kinks. It’s the same reason we want to push our kick off point low in the well: pulling tension around a crooked hole is going to get you a whole bag of normal force.
So now the deepwater people look a little less crazy when they’re paying through the nose for rotary-steerable systems in shallow, vertical holes. If you put a kink way up high in that well, by the time you get to 35,000 feet it’s doing some serious damage. The electronic control is worth it in those instances.
Ok, so the clear advice on how to minimize your normal forces comes to: push your KOP as low as you can, and drill a straight hole.
Next up … DS!
Distance Slid is the long spiral that the tool joint traces out as the drill string spins right ’round baby right ’round … and, um, advances into the hole. Clearly, more rubbing means more wear.
Now, in order to lessen the amount of wear, that means you should … drill faster.
I think you’re already working on that, so let me give you a corollary: if you are forced to drill slow, more slowly than usual, then a little flag should go off in your brain that maybe casing wear will start to become a problem. You know the well I’m talking about: the hole section that normally takes a week has stability problems, then you break something, then you fish something, then you break something else, then we’re sidetracking, then it’s a month later, then you start to check out the job boards … we’ve all been there. But the last thing you need at that point is a hole in your casing, so go check the ditch magnet for metal.
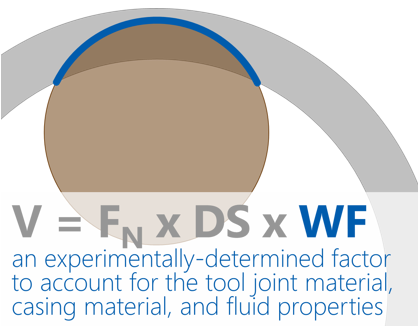
And now … WF!
I hope you know what “experimentally-determined” means—it’s a fudge factor where we do some type of lab testing to see if we can force this equation to match real life. Maybe.
Here’s the thing: you probably have access to that lab testing through your hardbanding supplier. They’ll give you data sheets, test reports, whatever, that lists out the wear factors they’ve generated based on the testing they’ve paid for. And that’s great.
It doesn’t apply to you.
Not that the testing isn’t good; it’s fine. It’s just that there’s a relatively standardized set of casing material, side forces, fluid properties, etc for those tests, and the likelihood that they line up perfectly with your well is vanishingly small.
So if you take the wear factor that your hardbanding manufacturer gives you, and plug it into your software that does these casing wear calculations, you’ll get results that are off by like 20% sometimes. But! Maybe that’s ok? As long as you understand that the wear factors are off, then you can (and should, says I) use your software for comparison—which trajectory is better, why is this well so much worse than the last one, etc—not for finding the remaining wall down to the last 0.001".
If you’re the type of person that leaves a baseball game in the 6th inning if the home team is losing, this is a good time to jump off this article. Three mathematical terms, make them all small, don’t trust the calculation to be exact, but use it to make changes to your design and see what effect it has. Thanks for coming! Enjoy your bobblehead!
If you’re the type of person who occasionally wonders how you raise rabbits for their wool (i.e., you’ve got a screw loose, like me), then I’ve got a story for you.
Once upon a time (specifically the late 1980s), oil prices did a swan dive into a burning dumpster, and drill pipe owners were trying to save money like everybody else. They realized that the biggest reason they had to downgrade or scrap their pipe was when the tool joint wore below the required OD. In order to slow that process down, they started to apply “hardbanding,” a band of soft metal welded around the outside of the tool joint, but with a hopper that dropped pieces of tungsten carbide into the weld puddle. Tungsten carbide is the hardest stuff you can reasonably get, so it seemed like these super-hard chunks in a soft weld matrix would keep our tool joints from wearing down. And it worked great.
Since tungsten carbide is also the stuff you braze onto watermelon mills to cut windows in casing for sidetracks, the casing didn’t fare quite as well. The operators didn’t pay much attention when it was just your drill pipe that was affected, but now we’re talking about my casing, so we need to have a heart-to-heart.
A joint industry project was organized, DEA 42 (that’s Drilling Engineers Association, not Drug Enforcement Agency), with the purpose of figuring out what drove casing wear and how we could stop it. Most of the industry was interested and involved, so everybody put money into a hat, and the hat went to an engineering group in Houston called Maurer Engineering.
Maurer developed a casing wear test stand, basically a piece of casing split lengthwise, set up at an angle, with a rotating and reciprocating tool joint pushed into it and drilling fluid flowing past. They standardized the parameters (force, RPM, reciprocation speed, etc) and set it up as an 8 hour test. They’d get everything ready, hit the “go” button, and go home for the night. The next morning they’d take all the measurements.
That test stand enabled them to do all sorts of fun things to characterize how casing wear works. They started comparing the data, and we were all in for a few surprises. First up is this one:
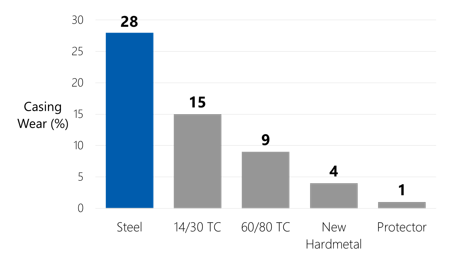
Lemme ’splain: “TC” stands for “Tungsten Carbide,” and the numbers are the mesh sizes that define how big the pieces are (bigger numbers = smaller pieces). With that information, cast your eyes back at that graph … I’ll wait for the shock to dawn on you.
Bare steel tool joints were worse than tungsten carbide hardbanding.
Wait, wha? This whole story started with “tungsten carbide hardbanding was rough on our casing.” Now you’re telling me that it would have been worse without the hardbanding!?
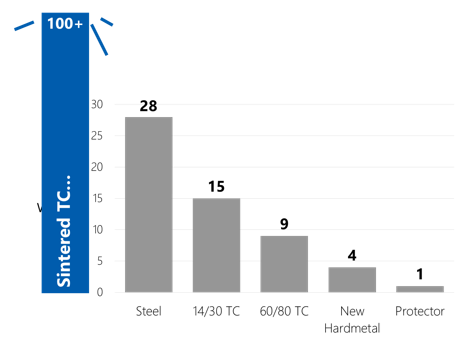
Lemme ’splain s’more: tungsten carbide comes in two basic shapes, “spherized” (which is a 2-dollar word for “round like a BB”) and “sintered” (broken, angular chunks). In that graph, we’re looking at the results of two different sizes of spherized tungsten carbide. However, most hardbanding used sintered pieces, because they’re cheaper and easier to get.
Why didn’t they test sintered TC, you ask? They did. It’s not on the graph because when they came in that morning the tool joint had worn all the way through the casing piece and into their machine. So more like …
My take home message? Tungsten carbide hardbanding sucks; don’t use it. Yes, I know you can make it better if you use the finer, spherized pieces (I believe that’s what “SmoothX™” is, if you’ve ever heard of it), but it’s generally not worth messing with.
It remains something of a surprise that bare steel was so bad. It seems like that’s because of the type of wear you see. Bare steel doesn’t cause wear mainly by scraping or abrasion, it’s more of a galling / fretting type of wear, where the two sides essentially cold-weld themselves together at a little spot. As the tool joint rotates, those spots pull off. You can actually confirm that yourself by looking at the metal on the magnet—they tend to be flakes, not little chips.
So tungsten carbide is bad, and bare steel is bad. What does that leave? Well, a drill pipe protector, which obviously helps but comes with its own difficulties, and “New Hardmetal.” That’s PinnChrome, a chrome-based, casing-friendly hardbanding that had just been developed. Since that time there has been an explosion of different casing-friendly hardbanding types, and that’s the stuff you want. It separates the bare steel of the tool joint from the casing, and it prevents wear to both sides.
Now the question arises, which casing-friendly hardbanding brand is best?
Hardbanding manufacturers: cover your ears, please.
It doesn’t matter. I’ve seen a lot of data, and they all perform quite well (reputable manufacturers, please, stay away from companies that aren’t around to stand behind their products).
What actually matters is not the content of the wire, but the quality of the weld. So find a good welder, and ask her what she likes to apply.
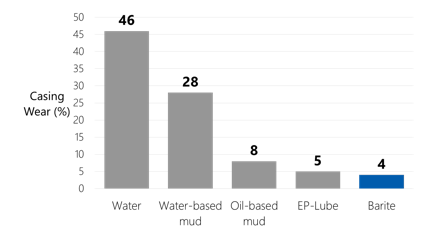
Ok, back to Maurer’s testing. Another good thing to deal with would be the drilling fluid:
Most of that isn’t surprising: slicker fluid gives you lower wear results. The surprise is right at the end, the best-performer. “Barite” doesn’t refer to a weighting agent put into the drilling fluid; it was just dry barite powder. (They were screwing around at that point—“EP Lube” is wheel bearing grease.) The dry lubricant did the very best job, probably because it also separates the tool joint steel from the casing steel, preventing that galling / fretting type of wear we talked about earlier.
Now, you can’t coat the inside of your casing with dry barite for drilling. What we learn, though, is to talk to your mud people, and see what it’ll take to reduce the friction in your mud system, because that will definitely help. In extreme cases, consider those little aluminum-oxide-bead things—they’re a giant pain in the butt and they’re expensive, but they do the trick bringing the casing wear down close to zero.
It is now time for me to play Paul Harvey and give you the rest of the story. (And a salute to those of you old enough to know what the heck I’m talking about.)
Maurer Engineering was bought by a company called Noble Engineering (no relation to the Noble Drilling and Noble Energy companies you are likely more familiar with). Noble Engineering was then bought by a European conglomerate, who decided at some point to divest their lab and engineering departments. So the fancy Maurer test stand that DEA 42 had bought was mothballed in a warehouse for several years.
Along came Stress Engineering (another firm in Houston) around the early 2000s, and they bought the test stand with the starry-eyed dream to start the casing wear testing business back up. They set up the hallowed test stand, prepared it with generic components for its first modern voyage, hit the switch … and stopped smiling.
When the thing was running the tool joint bounced around like a bumblebee on meth. It appears that the Maurer Engineering philosophy was essentially “that’s what happens downhole—let ’er bounce.” Fair enough, but the Stress Engineering philosophy is more like “that means that the results you get might be basically random scatter. To get anything repeatable we’d have to repeat the tests 5, 10, 30 times to get a good average, and we don’t think anybody wants to wait / pay for that.”
So Stress went to fixing the machine—change the angle of the pipe, stop reciprocating the tool joint, move the fluid flow, shorten the length of casing, I honestly don’t think there’s anything left of the original machine. But now we get results that are repeatable and consistent day after day, material after material. It’s a very good test.
But it’s not the same test.
In fact, the new test gives you wear factors for a given hardbanding that are worse than the old test would have (since the sample remains firmly planted in the casing the whole new-test time). Which then means that any hardbanding company that’s been around long enough to get the old Maurer test keeps repeating those same results, because they look better. Younger companies have to publish new test results, which look worse. (I recommend not talking about it with them; I hear enough of “it’s not fair!” from my kids.)
So the next time a hardbanding manufacturer gives you wear factor results, make sure you know the test process, too: Maurer? Stress? API RP 7CW? (That’s a new-ish standard that Stress Engineering was involved with writing. It’s also a very good test, but it’s also a little different from the previous ones. Apples to apples, man.)
They learned something else from their new testing, too. Remind your brain of the formula (developed by Maurer Engineering, in case I didn’t mention that before):
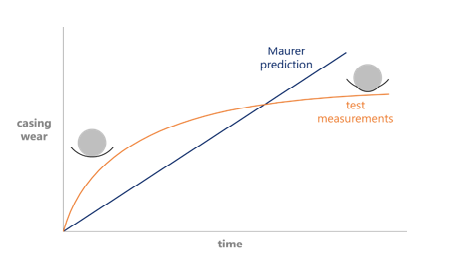
For a given test, the Normal Force stays constant over the test period, the Wear Factor stays constant, and the only thing changing—at a constant rate—should be Distance Slid. The math says the casing should wear linearly with time.
It don’t.
When you take measurements during the test (we don’t leave it overnight anymore), the casing wears really quickly at the beginning, then it slows as the test moves on. The theory is that we shouldn’t really be using normal force, but instead the contact pressure between the tool joint and the casing as the driving parameter. At the beginning of the test, the contact area between the tool joint and casing is essentially a line, so the pressure is really high. As the test goes on, the tool joint wears a groove into the casing, spreading that force over a larger area, decreasing the contact pressure. (I buy that.)
Further, it is theorized that the shape of the curve is asymptotic.
(I’ll wait for you to go ask your kids … da dum dum doooo dm … Good! It flattens out, getting closer and closer to a fixed value it never actually reaches.)
If that’s correct, then there’s a “threshold pressure” which, if we stay below that value, we’ll never get any wear.
(Honestly, I don’t buy that. There’s a lot of different mathematical formulas that’ll fit the type of curve we see in the testing, not just ones with asymptotes, and it just doesn’t make sense that infinity of rubbing causes zero of wear, cf. the Grand Canyon. As far as I know—and, really, I’ve seen my fair share of the actual data—nobody’s ever had one of these casing wear tests that goes a significant amount of time with no measurable wear. You believe what you want.)
That threshold pressure idea comes up in the reports that you sometimes see outlining the results of a casing wear test. The data will be fitted with this logarithmic, asymptotic curve, then the resulting threshold pressure will be used to calculate how wide and deep the groove in the casing would be when it stopped wearing. I’m not sure why they do that; the “steady-state wear groove width and depth” will obviously change with different tool joint and casing sizes, so it’s not like that data saves you any time unless you happen to be using the same geometry as the test did. But that’s what it means.
Where does that leave us? Well, right here, which is a little northwest of over there. Which is not lost! It is however, easy to get lost, so remember what I said earlier: the test is not likely to match your well. Take the results, dig into them if you like, run your casing wear models to see how significant any given change might be, but don’t think it’s perfectly accurate. Better or worse, faster or slower, those are the things you’re looking for.
And put casing-friendly hardbanding on your drill pipe. ’Cuz casing wear is no fun.
