And the House Comes Crashing Down
Once upon a time (like, the 1960s), there was a man named W.O. Clinedinst (I’ll call him Bill). Good ol’ Bill was a thorough man, very interested in the capacity of casing and tubing. He led the testing that told us about jumpout failures, for instance, and used those test results to give us the jumpout equation that we still use today.
Similarly, he did a baker’s boat load of collapse testing on casing, and used those results to create an equation that is the current basis of API collapse capacities.
You know what “collapse” is, right? If you apply pressure on the inside of a piece of pipe, it fails by gettin’ blowed up. (Technical jargon right there.) That’s pretty clear and easy to understand. When the excess pressure is applied on the outside of the pipe, the failure is actually an instability thing, not unlike buckling in a column. (In fact, completely not unlike buckling—it’s precisely buckling, just in a different direction.)
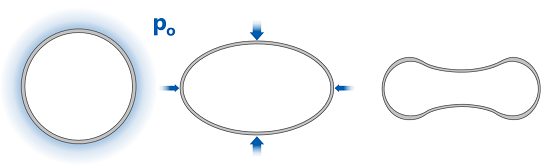
Basically every real piece of pipe has a little bit of ovality to it, so the external pressure (which is even all the way around) creates a different squishing force in different directions (because there’s a long side and a short side to the oval). As the pressure increases, the difference in forces leads to even more ovality, which leads to even more lopsided squishing, which eventually gets to be too much for the pipe to handle. So it smashes flat.
Bill’s equation for a pipe’s collapse capacity—ya know, how much external pressure it can carry before “smash flat” comes around—has three parts to it:
- Yield Strength Collapse: This is the gun-barrel equation for very thick tubes. Bill used the Lamé pressure vessel equation to calculate the pressure at which the ID fiber starts to yield, and that was his failure point.
- Elastic Collapse: This is the beer-can equation for very thin tubes. A thin tube goes from round, to oval, then becomes unstable and smashes flat all without any significant yielding (except the “smash flat” part, but that’s after the actual failure starts), thus the name. Bill’s equation is based on instability of that thin tube.
- Plastic Collapse: Clearly there has to be something in between “gun-barrel” and “beer-can.” In this middle region, there’s both material yielding and instability phenomena going on, which leads to an extremely non-linear situation. “Non-linear” is math-speak for “it’s a crap shoot, man.” So Bill did oodles of tests to figure out what’s going on and developed a Plastic Collapse equation that would match that data.
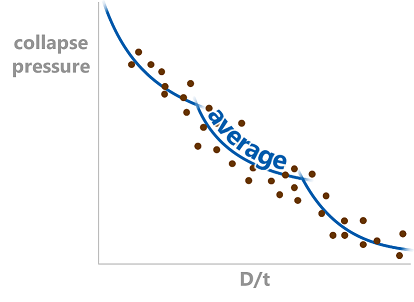
It’s at this point that something sad happened to Bill’s equation. He had lovingly crafted this expression in three different pieces that allows you to predict the average collapse capacity of various sizes, weights, and grades of casing. The average number is a bad number to design to, though, because by definition half of your failures happen before you get there. There’s a decent amount of scatter in collapse data, so Bill made a minimum, or design, equation for everyone to use that would mean at least 95% of collapse failures happened above that design value. But when he shifted the lines, the Plastic Collapse line and the Elastic Collapse line didn’t cross anymore. So a fourth equation had to be introduced, the Elastic-Plastic Transition, that would connect the dots in this stupid math problem.
Bill’s collapse equations weren’t perfect, however. (They do a darn fine job, by the way; the imperfection comes due to the changes in pipe manufacturing quality between then and now.) They tend to underestimate the collapse pressure, meaning that, in general, our casing designs are over-built. That does mean that we’re unlikely to have a failure, but we pay for that extra beef in cost and weight.
These days, however, we’re much smarter than Bill, so we know we can create a much better equation that he did. (That was sarcastic, in case you missed it.) To take into account the fact that manufacturing is better (so we get rounder pipe with more consistent material properties), there is a newfangled equation called the Klever-Tamano equation that is used. That equation’s got three parts to it, too:
- Yield Collapse: Again, the Klever-Tamano gun-barrel equation is based on Lame’s thick-walled pressure vessel. The big difference between Bill and KT is that Bill assumed that ID fiber yield was failure. KT says that the casing can yield all the way through the thickness before anything bad happens. They say that on the basis of some testing and FEA work that shows it.
- Elastic Collapse: KT uses shell theory to find an instability equation for a thin-walled tube (beer can). While it looks and sounds a bit fancier, it’s strikingly similar to Bill’s version.
- Transition Equation: In order to deal with the middle bit, KT just smashes the two equations together with a weighting function. If you’re all the way on the beer-can side, you are only really using the beer can equation; if you’re on the gun-barrel side, you’re using the gun-barrel equation, and in the middle you’re using both equations. So the KT relationship is actually just one equation, although it’s stupidly complex.
There’s something critical that I didn’t mention yet. At every step in the KT equation, there are “bias factors” and “decrement functions” added into the equations. Remember my secret math rule: any time you hear the words “factor” or “function” or “coefficient” or “exponent” in an equation, it’s a dead giveaway that we, again, have no idea what’s going on. So the Klever-Tamano equation itself makes sense, especially because it’s very similar to the original Clinedinst equation, but it’s chock-full of empirical fudge-factors used to tune the equation so that it matches real-life data.
And there’s the rub. To use this new equation, you need data, and every manufacturer is going to have a different set of data, taken under slightly different conditions, giving everybody slightly different results. API is trying to standardize things, but API is, cough, slow, and honestly the rest of the industry tends to be slow on the uptake if API does manage to change something.
So. We have regular, API pipe, for which you use Bill’s equation to find the collapse capacity as described in Annex E of API Technical Report 5C3. Then you flip the page, and Annex F tells you how the API committee went through an enormous (and boring) project to find a new collapse equation that would replace Bill’s equation. Bill had testing; they got testing (3,171 tests; from different manufacturers; all different sizes, weights, and grades). Bill used his equation; they used the Klever-Tamano equation (after some discussion about which one they liked best). Bill had an “average” equation and a “design” equation; they have an “ultimate limit state” equation and a “design” equation, too. On top of that, their equation can take things like measured ovality, residual stresses, and the like into account. Anything you can do I can do better.
But this raises the question: If Annex F gives me an equation that is newer and slicker and better than Bill’s equation, why do we still use the old one? Here you go, straight from the horse’s mouth (5C3, that is):
…Some members felt that the ratings thus calculated (Clause F.6) are already an improvement on the old, and therefore should now replace the old Clause 8. Others, however, believed that the industry needs more time to consider the new method, and in particular the question of characterization of probabilistic data for worldwide production.
The new work has therefore been kept as informative at this stage. It is hoped that as the industry becomes more familiar with the method, the question of data characterization can be fully resolved…
That’s their story, and I’m inclined to believe it a little bit. I think this is the other reason, though:
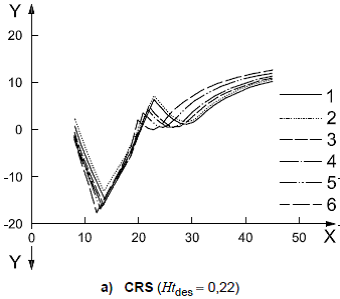
(Whomever made the decision to label the axes with “X” and “Y” and the lines with “1, 2, 3 …” so that the legend needs its own legend needs a serious talking to.) “Y” is the percentage difference between the new equation and the old API equation; “X” is the D/t ratio. Which means that for low D/t pipe, the new equation actually gives a lower collapse capacity than the capacity we’ve been using for Bill-knows-how-long, which is not the direction we wanted to move.
Omigoodness we’re not done. You flip the page in 5C3 yet again, and Annex G describes how to use basic statistics to find your own collapse capacities. That means that, if you have some test data for your very own 9-5/8", 53.50#, T95 pipe, then you can figure out a good collapse rating for it using the Student T distribution. Simple enough.
Then Annex H comes in, and says that you can go through the same enormously boring process that API used in Annex F to find your own collapse equation. This means that you don’t just look at 9-5/8" casing; you look at every test you have for every size, weight, and grade, and you tinker with the KT fudge-factors to match that data. Not simple, but it is possible, although you have to trust their statistical approaches.
Fun (and also maddening and terrifying) fact: Annex F, Annex G, and Annex H all provide different ways to allow a manufacturer to find their own high-collapse rating (that is, higher than the “traditional” rating given by Bill’s 50-year-old equation). But they are all still “informative,” meaning nobody is required to even read it.
Thus, we have “High-Collapse” grades of casing, which use who-knows-what to get slightly higher collapse ratings. And you have to figure out if you trust the higher numbers or not based on information that is totally opaque. I can’t really solve that problem, but here’s a list of gotchas so I can be as helpful as possible:
- How did they calculate the higher ratings? Keep asking until somebody gives you an intelligible answer, something a little more detailed than “Oh … er … testing.”
- Speaking of testing, how exactly did they do that? Annex I in 5C3 gives a good method, but it’s “informative” again.
- What about their pipe gives them the better ratings? Again, details please (controls on ovality, eccentricity, isotropy, and material strength are typical answers).
- Do you believe that? I encourage you to be skeptical. Cynical, even. I am (you’ve likely noticed).
- Do any of those “controls” above mess up another area of the design? For instance, high-collapse P110 may have an internal minimum yield strength of 125 ksi (still under the maximum limit) to help get higher collapse capacity. That’s fine, unless you’re in sour service where the higher strengths mean higher hardness (there’s no hardness limit for P110 baked into API 5C3), which leads to failures of a different sort.
