Laboratory
Salt Impact Forensics
Sep. 16 2019
Using Cl-/Br- Ratios and Other Indicators to Assess and Differentiate Road Salt and Other Impacts in Groundwater
Municipalities across Canada use sodium chloride (NaCl) based road salt, primarily “Rock Salt” or Halite, as an economical means of de-icing road surfaces. At the same time, sodium (Na+) and chloride (Cl-), as well as electrical conductivity, sodium adsorption ratio (SAR), salinity and sodicity (which can be significantly influenced by Na+ and Cl- concentrations), are monitored and regulated in many jurisdictions as parameters of environmental concern.
Because of their stability and conservative movement in aquifers bromide (Br-), chloride (Cl-) and iodide (I-) have proven to be valuable as tracers for groundwater movement. More recently, evaluation of the concentration ratios for these ions, particularly chloride and bromide (Cl-/Br-), has also been used to study potable groundwater systems, and to establish the origin and evolution of surface and subsurface salt waters and brines.
How Road Salt Works
The freezing point of water is 0⁰ C (32⁰ F). At this temperature, water molecules organize themselves into crystal structures, becoming ice as shown in Figure 1. Salt lowers the freezing point of water by interrupting this crystallization process. The road salt dissociates into sodium and chloride in water. Sodium and chloride then move throughout the water and take up space within the structure of molecules in the water. This pushes the water molecules apart and disrupts the ice-forming process, thereby lowering the freezing point of water.
While this proves to be an effective method for preventing ice formation, it does suffer from an inherent limitation. At temperatures below -18⁰ C, the capacity for NaCl salt to de-ice is diminished.
Figure 1: How road salt interrupts the water from freezing
History
Granular sodium chloride was first used to de-ice roads on an experimental basis in 1938. Since then, the use of sodium chloride, as well as other de-icing agents, has become widespread.
Annually, approximately 5,000,000 tonnes of rock salt is used across Canada on roadways alone. On average, the cities of Toronto and Calgary use approximately 140,000 and 35,000 tonnes, respectively.
Environmental Impacts
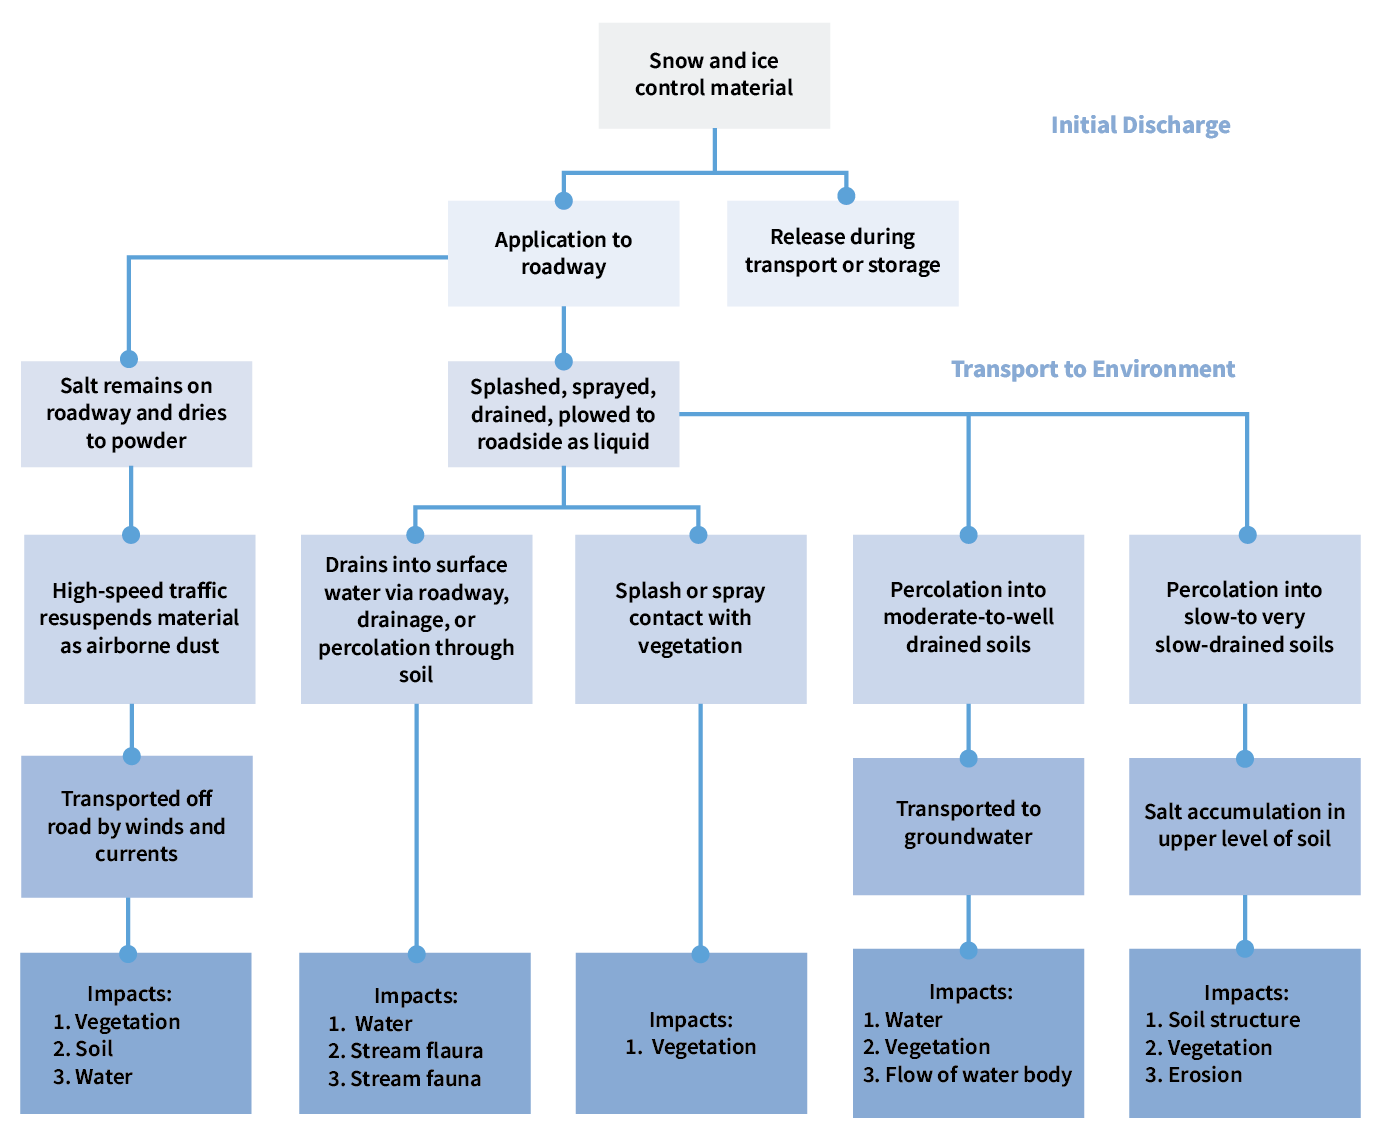
Typically, NaCl enters the environment through runoff resulting from snowmelt and from wastewater plants as these are normally not equipped to remove NaCl during treatment. Other potential pathways are illustrated in Figure 2.
Figure 2: Environmental pathways for road salt impacts [1]
Regulations
While not regulated as the salt (NaCl), the individual ions are regulated in most jurisdictions as shown in Table 1 below. NaCl is also monitored through proxy measurements such as: salinity (as measured by electrical conductivity (EC)) and sodicity; and based on sodium adsorption ratio [2] (SAR) measurements.
Table 1: Sodium and chloride regulations in Canada
| PARAMETERS | BC | AB | SK | MB | ON | CCME |
|---|---|---|---|---|---|---|
| Drinking Water | ||||||
| Sodium (mg/L) | 200 | 200 | 200 | 200 | No Value | 200 |
| Chloride (mg/L) | 250 | 250 | 250 | 250 | No Value | 250 |
| Groundwater | ||||||
| Sodium (mg/L) | No Value | 200 | 200 | 200 | 490 | No Value |
| Chloride (mg/L) | 100 | 100 | 250 | 250 | 790 | No Value |
| Surface Water (Protection of Freshwater Aquatic Life) | ||||||
| Sodium (mg/L) | No Value | 200 | No Value | No Value | No Value | No Value |
| Chloride (mg/L) | 1,500 | 100 | 120 | NV | NV | 120 |
| Soil | ||||||
| Sodium (ug/g) | 150 | No Value | No Value | No Value | No Value | No Value |
| Chloride (ug/g) | 100 | No Value | No Value | No Value | No Value | No Value |
Forensic Applications of Chloride (Cl-), Bromide (Br-) and Iodide (I-) in Road Salt
Chloride, bromide and iodide are present in salt. Chloride is generally 40-8,000 times more abundant in nature than bromide. The most common analytical methods used to determine Cl-, Br- and I- include: ion chromatography (IC); colourimetry; and neutron activation analysis (NAA). However, methods to determine these ions at trace levels are now available at Bureau Veritas using inductively coupled plasma coupled with mass spectrometry (ICP/MS). Table 2 lists the available analytical methods and representative detection limits.
Table 2: Analytical methods and typical reporting limits for Cl-, Br- and I-
| PARAMETERS | NAA | ION CHROMATOGRAPHY | ICP/MS |
|---|---|---|---|
| Iodide | 2 ppb | ||
| Bromide | 20 ppb | 50 ppb | |
| Chloride | ~1ppm level | 10 ppb | 5 ppm |
A preliminary, in-house survey of different commercially available salt products shows differences in the relative amounts (measured by ICP/MS) of Cl-, Br- and I-, depending on the source of the salt (see Table 3).
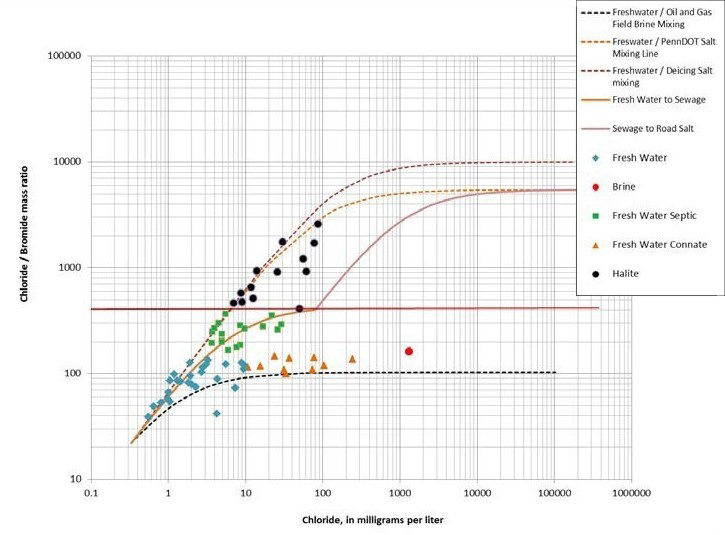
It has also been demonstrated [3] that the ratios of these ions can be used to distinguish pristine groundwater from wastewater sources and other anthropogenic sources including road salt.
Table 3: Cl-/Br- and Cl-/I- ratios for six commercial salt products
| PARAMETERS | ROAD SALT ("BLUE SALT") | ROAD SALT (GENERIC) | COMMERCIAL SEA SALT | COMMERCIAL TABLE SALT | HIMALAYAN ROCK SALT (PINK) | COMMERCIAL COARSE SALT |
|---|---|---|---|---|---|---|
| Iodide | ND | 0.3 | 30 | 70 | ND | ND |
| Bromide | 1,200 | 1,600 | 50 | 310 | 60 | 48 |
| Chloride | 510,000 | 470,000 | 260,000 | 540,000 | 520,000 | 490,000 |
| Cl-/Br- | 430 | 290 | 5,200 | 1,700 | 8,700 | 10,000 |
| Cl-/I- | 5.1 x 10⁸ | >1.6 x 10⁶ | 8,700 | 7,700 | 5.2 x 10⁸ | 4.9 x 10⁸ |
Note: Where I- was not present above the reporting limit of 2 ppb, ½ of the reporting limit was used to calculate the Cl-/I- ratio.
Figure 3: Cl-/Br- ratio vs. Cl- to differentiate five water types: fresh water, brine, fresh water septic, fresh water connate and halite [4].
Bureau Veritas has also demonstrated, through the analysis of “real world” samples, the ability to differentiate different sources of salt impacts in groundwater.
References
[1] Reprinted from: National Cooperative Highway Research Program Report 577: Guidelines for the Selection of Snow and Ice Control Materials to Mitigate Environmental Impacts
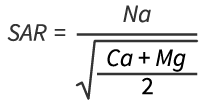
[2] Sodium Absorption Ratio (SAR) measures the proportion of sodium to calcium and magnesium in soil solution:
[3] Katz, B.G. et. al.: ”Using Cl/Br ratios and other indicators to assess potential impacts on groundwater quality from septic systems: A review and examples from principal aquifers in the United States” J Hydrol 397 (2011) pp 151-166
[4] Reprinted from: Naily and Sudaryento 2018 IOP Conf. Ser.:Earth Environ. Sci. 118 01202


