Laboratory
Comparing Gold Values Determined by Fire Assay and Aqua Regia
Jan. 4 2021
The complexity of gold bearing systems means that geochemistry must often do more than determine how much gold is in a rock. Fire assay remains the benchmark technique for quantifying gold, but minor and trace element data are often used to vector within a mineralized system with Aqua Regia as the leach of choice. Aqua Regia is very good at dissolving gold, and as a consequence geochemists and geologist are often faced with reconciling two gold numbers for each sample, and sometimes they do not match. This article examines how the distribution of gold in geological samples can affect the representivity of a sub sample and the challenges this creates for data integration.
It can sometimes be difficult to compare data from different analytical techniques, especially when they utilize very different sample weights. Fire assay is always done on a large subsample to ensure it is representative and to mitigate against the common situation where gold occurs as relatively large particles. Comparatively, Aqua Regia digestion for trace and pathfinder metals (including gold) is usually determined on much smaller subsamples to reduce costs, and because most elements have a relatively homogeneous distribution within a sample.

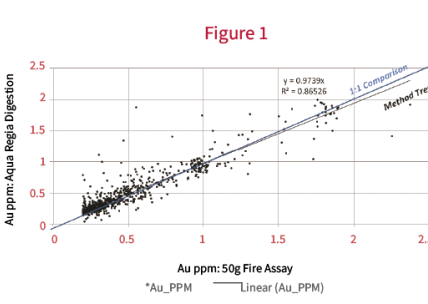
Figure 1 shows data for a set of samples that were analyzed for Au using both a 50g fire assay charge, and a 0.5g subsample leached with Aqua Regia.
The results show relatively good agreement between the two methods. It suggests that a substantial amount of the Au is present as fine particles, and that a sufficient number of particles are captured by the small test portion used for the Aqua Regia leach to produce a representative result (compared to the 50 g Fire assay). There is a small positive bias towards the 50 g fire assay. This could be attributed to the fire assay method being a total digestion, whereas, Aqua Regia is a partial digest. There may be a few very fine particles of Au being entirely encapsulated by refractory minerals (i.e. quartz) that are not available to leaching.
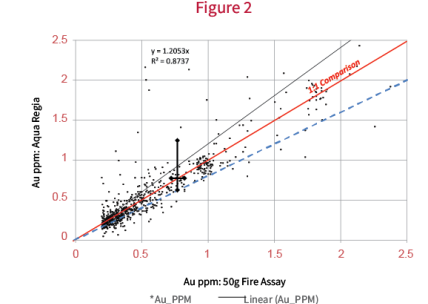
Agreement between small sample weight Aqua Regia and large sample weight fire assay is not always the case. The data in figure 2 is from a suite of samples that was subsequently determined to contain coarse gold by follow up metallics fire assay. It shows a bias in Aqua Regia results that becomes increasingly pronounced at higher grades. Compared to figure 1, however, figure 2 demonstrates that for some samples, the Aqua Regia results are inconsistently higher than the fire assay. The difference is not systematic.

Figure 2 illustrates that at low Au grade, there is good agreement between FA and Aqua Regia suggesting that there is a relatively consistent component of fine gold particles distributed. As the grade increases, there is an ever higher probability that larger particles of Au are sampled, and is the underlying cause for the observed bias.
The coarse grains appear to be less abundant (suggested as most of the data agree well). However, when one (or a few) of the grains are captured in a test portion they effect the results of the two tests in very different ways. Take, for example, a single grain of native Au that is captured in each of the analytical methods (aqua regia at 0.5 g and fire assay at 50 g). One grain in a 50g sample will have much less of an effect on the reported concentration than would one in a 0.5g sample. In fact, that nugget would have an effect 100 times larger on the smaller sample. Aqua regia is very effective at dissolving native gold.
To further illustrate, error envelopes have been added to Figure 2 showing the expected error for a 0.5 g analysis versus a 50 g analysis for Au. The dashed blue line marks the bottom limit on the negative error and is to be expected due to fine gold present, which is consistently sampled in both test portion weights. The black line is the positive corollary of the blue line and is the expected positive error (if error is random and has an even distribution about the mean). From the figure, we observe that there are many more points above the positive error envelope than below the negative error envelope. The positive bias is much larger due to the impact that a single large nugget of Au has on a 0.5 g analysis (there is really no upper limit or “ceiling” on this). The concept has been drawn stylistically (not to scale) using the black error bars. They show not only that the expected error is larger for the low sample weight test, but that the expected positive error is larger than the expected negative error.
In conclusion, the comparison of data from different analytical techniques needs to be performed carefully, particularly for gold. Depending on the mineral species in which an element resides, each test will be variably effective at extraction - in many cases the results may not be exactly the same. We can use the differences, along with our understanding of the sample mineralogy, to gain additional insight into the geological systems.