Your Failure is Probably Fatigue
You wanna know a secret? If you’re not sure what’s caused the broken stump of steel you just pulled out of your well … guess fatigue. It’s a good guess.
Still, it’s nice to not have to guess. Watch this:

Fatigue!

Fatigue!
Definitely fatigue!
I know that’s a bolt; it’s still fatigue.

Fatigue!

Fa … wait, no, that’s a cat.
The point is, once you know the signatures of a fatigue failure, you’ll be able to pick them right out of a lineup of broken steel. Once you know it’s fatigue, you can do the right things to stop failure-ing, and that sounds a lot like an improvement to me.
Ok, so what are these alleged “fatigue signatures”?
|
Image 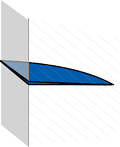
|
Flat, planar cracks. Fatigue grows by slowly opening and closing a crack tip, so the crack that’s left behind is flat and smooth. |
|
Image 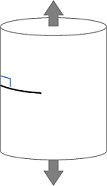
|
Perpendicular to the pipe axis. The growth of the fatigue crack happens through tensile stress cycles. Since we pull along the length of our pipe (whether that “pull” is regular tension or bending stress), the crack opens up fastest when it’s perpendicular to the pull. |
|
Image 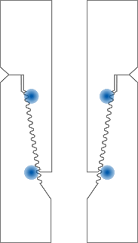
|
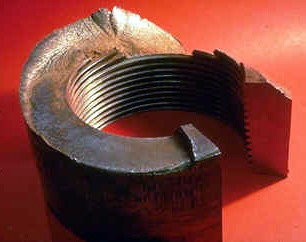
At high-stress points. Fatigue cracking is driven by stress hot spots, so it’s going to be in the place(s) where that point stress is highest. That would be the last engaged threads of BHA connections, and slip and upset areas on drill pipe tubes. |
|
Image 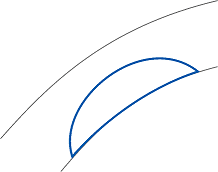
|
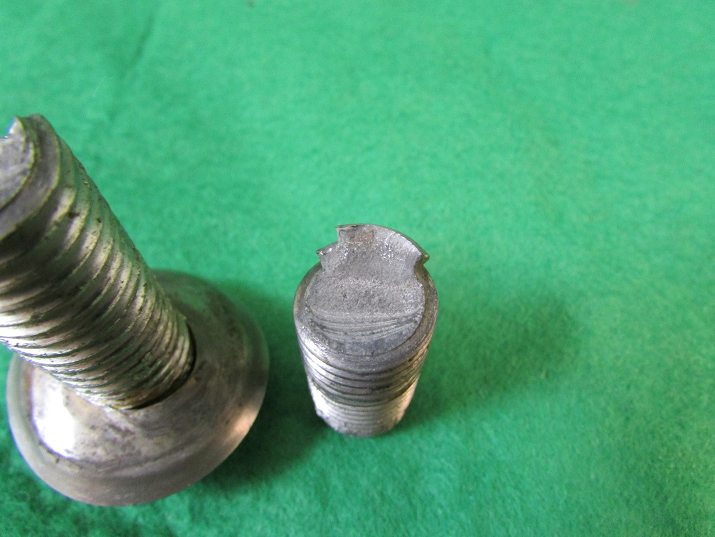
Thumbnail crack shape. Fatigue tends to start at one spot and grow in all directions, so the crack itself usually has a semi-circular shape to it. |
|
Image 
|
Ratchet marks. Fatigue can start with multiple tiny cracks that grow together, leaving little steps at the initiation site. You don’t always see ratchet marks, but if you do it’s a dead giveaway. |
|
Image 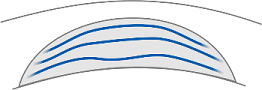
|
Beach marks. Whether you see these or not is highly material- and environment-dependent, but sometimes you can see the history of the crack growing right there on the crack surface. |
Now I’ll complicate matters. This one is also fatigue:
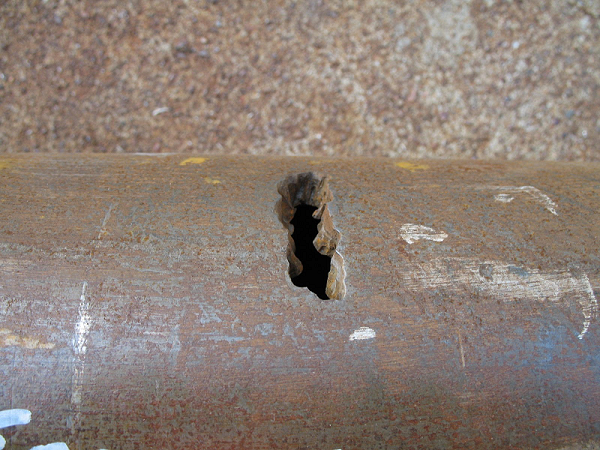
But … it has literally none of the signatures I mentioned above. It’s a weird, bulbous hole in the side of my drill pipe tube. How is that fatigue?
There’s a fun trick we use in laboratories, where we cool the steel down in liquid nitrogen until it’s super brittle, then whack it apart to see what’s the happnins on the inside:

Now you see it, don’t you? There’s a washout through the middle, but the smooth, planar, semi-circular crack around the edges tells the story nicely. A fatigue crack started on the ID surface of the drill pipe tube and grew through the wall thickness, which then allowed for fluid flow through the pipe wall. That fluid flow eroded away the steel, leaving our characteristic washout signature, and leading to an unplanned trip. (And colorful language.) Washouts—in drill pipe tubes, at least—are always fatigue cracks when you get to the chewy center.
(No, there is no “mud turbulence” that’s going to wash out your drill pipe. The fluid will not be driving carefree down the middle of the tube, then suddenly hit the brakes and make a hard left for no particular reason. Washouts in connections can be a few different things, but washouts in drill pipe tubes are always fatigue.
Yes, that’s an absolute statement, which seems dangerous to make without qualification. No, I’m not going to change it.)
That leads us to the reason why it’s so nice to be able to recognize a fatigue (or any) failure type: I’d like to not do that anymore. But how?
Let’s have a think. I would like to do a test on my steel to figure out how it behaves under fatigue loading. So I take a piece, and I bend the poor thing, and then hold that bend whilst I rotate it around and around and around and … then it breaks.
That’s not super helpful unless the bending in the lab exactly matches the bending I’m going to see in real life. So I try a bunch of applied bends on a bunch of specimens, each time holding that bend and cycling around and … (you get it) until it breaks. I can plot all those things on a graph (I am an engineer, after all, and graphs are kinda my thing), and I get the classic stress-life curve (or S-N curve):
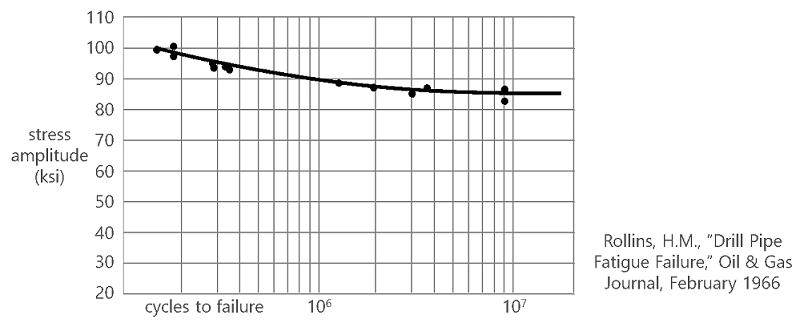
(No, I don’t know why we put stress on the Y-axis, when it’s clearly the independent variable here. You’ll have to take that up with August Wöhler; he probably has his own blog.)
Looking at that curve, I think I see it getting flat at the end. That would mean that, if I apply stresses smaller than the “flat” stress, then the steel will last … forever! I won’t never ever have a failure!
Yeah, I don’t believe it, either. I’ll even ignore the academic minutiae, wherein I could argue that we have traditionally not tested the specimens to infinity, and once we do start increasing the test length we lose that endurance-limit behavior. Just practically speaking, when I could call 10 million close-enough-to-forever, I have to realize that corrosion has a bad habit of making the bottom fall out of that S-N curve. And, you know, we pretty much always get corrosion.
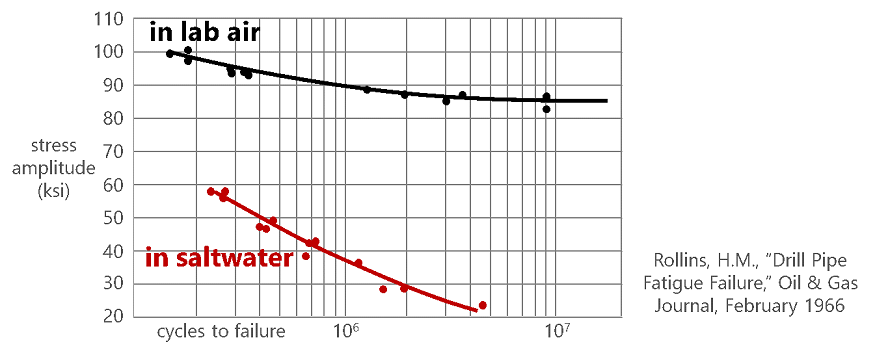
So the endurance limit idea—where we try to keep our operations below a threshold stress in order to avoid fatigue failure—is just wrong. (Even if it is in an API Recommended Practice. Which I’m trying to help change.)
There is another way. Instead of calculating the whole cotton-pickin’ life of our tools, we could calculate only how quickly a crack grows, if there happens to be a crack there. The crack growth takes much less time, so it’s much less affected by corrosion, see, and I don’t need to track the whole flippin’ life of the pipe (it took a year off college to backpack through the Alps, it traveled to Africa with an environmental activism team, etc). I’m no longer trying to calculate when failure is going to happen; now I’m just trying to see how fast an imaginary crack would grow if it’s present. The idea would be that I inspect the pipe when my imaginary crack grows to failure—I’m calculating the perfect inspection interval.
To do that, we use another pretty graph, called a crack-growth curve:
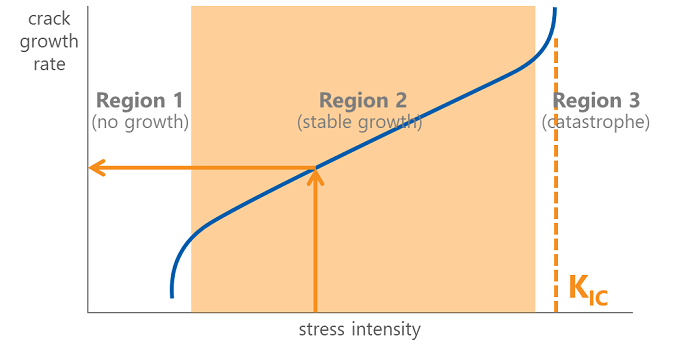
A quick look says that, in order to find the crack growth rate, we have to first find the “stress intensity” (in ten cities). Let me see if I can find the stress intensity formula … Jiminy Cricket! That got ugly fast. Suffice it to say that stress intensity is a way to describe the stress at the tip of a crack, which is complicated by the fact that the shape and size of the crack actually makes a difference in the stress state. The short version: small cracks are better and big cracks are worse, even under the same overall stress.
The stress intensity, as ornery as it is, isn’t the real difficulty, though. Nope, the real problem comes when we realize that all that fancy crack-growth testing that’s required to fully describe the crack-growth curve is hardly ever done. That means that we’re just guessing at the blue line above, and that leads to error in our crack-growth calculation … to the tune of ± an order of magnitude. So you might calculate that the perfect inspection interval is every ten wells, but that might actually mean every one well, or every 100 wells.
Not. Super. Useful.
This is a little depressing. My curves (both S-N and crack-growth) are failing me, and I don’t really have many other options in designing for metal fatigue.
But I got me an idea.
What if I just pick a crack-growth curve, knowing that it’s likely to be wrong? Then I go through the complexities of finding the stress intensity for a particular operation, and I calculate a crack growth rate, which I can use to find my perfect inspection interval … which is wrong. But! I can make all the same assumptions about my crack-growth curve, choose a different operation, and work out another perfect inspection interval. Which is also wrong.
Two wrongs, however, make a right, at least in this way: we assumed the same unknown stuff, so any differences between the answers is the result of changing the operation, which is what we have control over. So if Design A has an inspection interval that’s 3 times longer than Design B, then I really believe that A is 3 times less damaging to my drill string than B. And I should pick that one.
This method (we like to call it the “comparative design approach”) is not at all what we expect. We want to calculate exactly when and how a failure is going to happen (next Thursday at 3:30 in the afternoon). But since the curves that would describe real life are shrouded in mystery, those calculations are about as accurate as the sniper scope on a Nerf gun. Instead, I’m just going to make a list of all my options, work my way through the calculations, and pick the option that is the best (with absolutely no promises about when it’ll actually break).
This comparative design thing is so non-intuitive that we have a hard time explaining it to people, and when we do manage to be understood we usually aren’t met with excitement. Once the dust has settled, though, a surprise pops up: this thing actually works. If you always choose the option with the lowest amount of fatigue damage, then you’re actively choosing the lowest-risk operation available to you. It’s like betting on the house: the house always wins, because the house has the best odds.
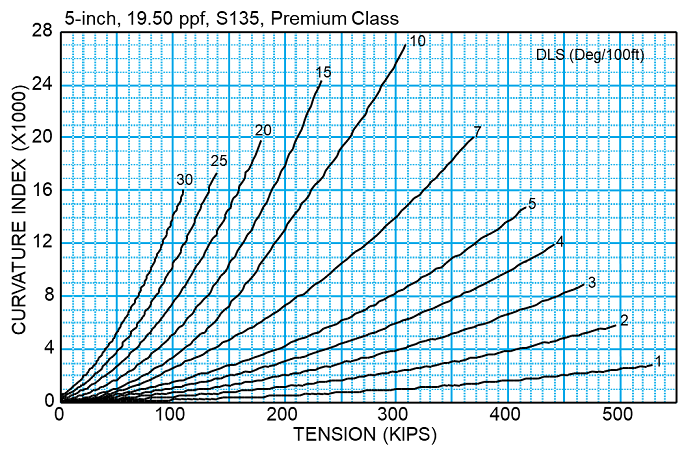
Maybe I’ve convinced you, maybe not. Just know that Grant sez there is a way to choose better drillstring designs that is technically based and field proven, even if it seems a little odd at first. Know also—and this is critical—we’ve already done all that calculation stuff for you. This imaginary-crack-growing-in-drill-pipe thing is the ideology behind Curvature Index, which we’ve got printed in svelte graphs in DS-1 Volume 2.
In fact, you can use it to actually set your real-life inspection interval, although that’s a whole other ball of colorful horses. Maybe I should write another article about that …
